Getting Started
Prerequisites
Currently in order to use Statusflare you must posess either a Google or Github account and allow access to Statusflare. Additionally, you must also have a valid endpoint to monitor.
Account creation
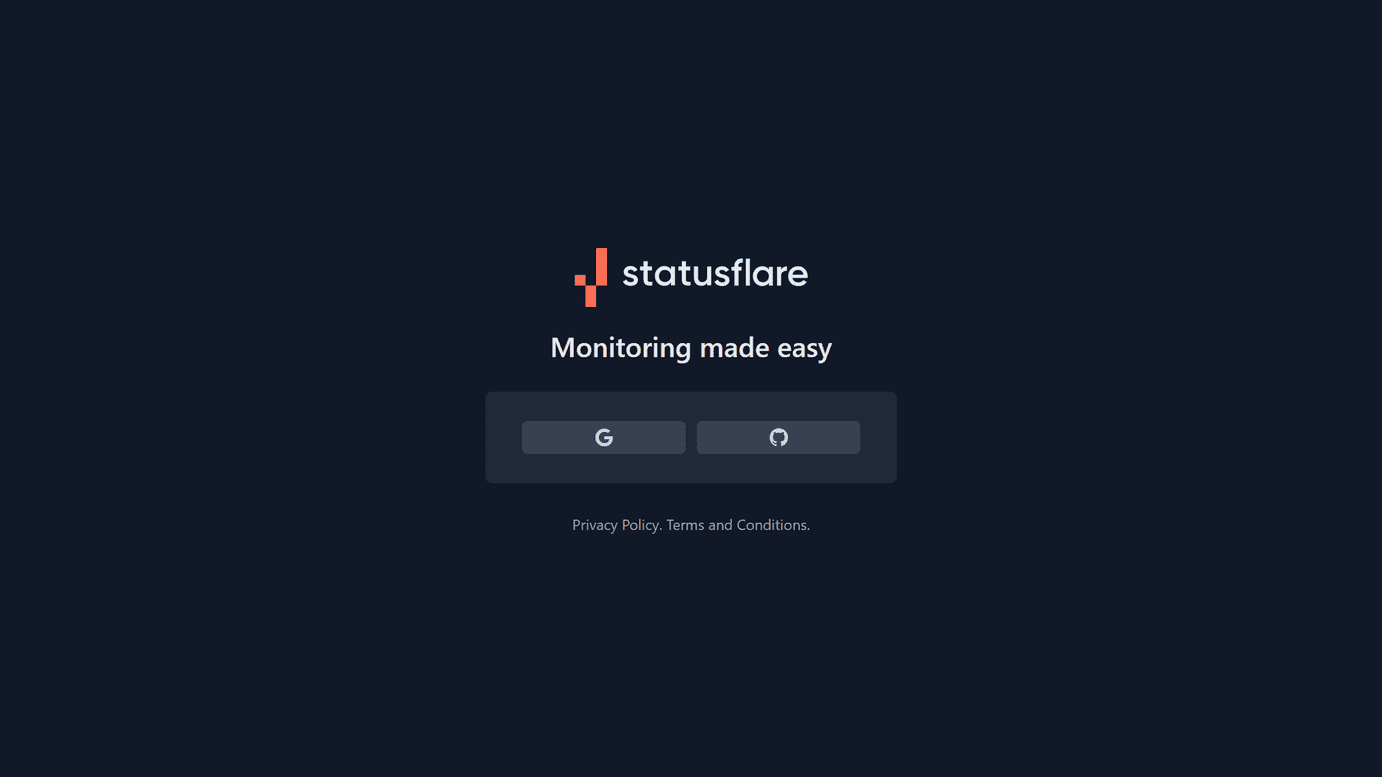
To create an account, select the "Google" or "Github" logo on the login screen.
Note: I am using a google account for this tutorial.
Login with your account. If you are signing up, a Statusflare account will be automatically generated at sign in.
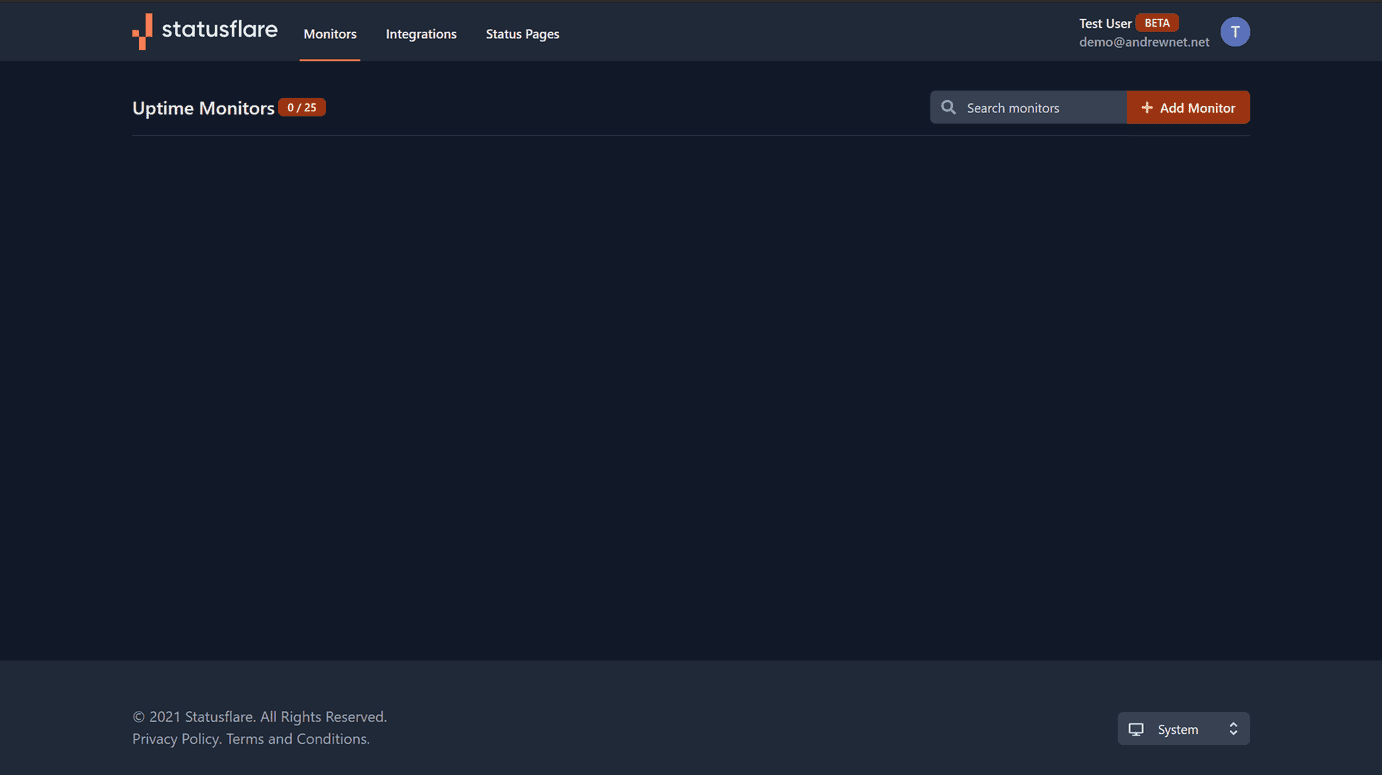
After sign in, you will be taken to a screen like this:
Monitor setup
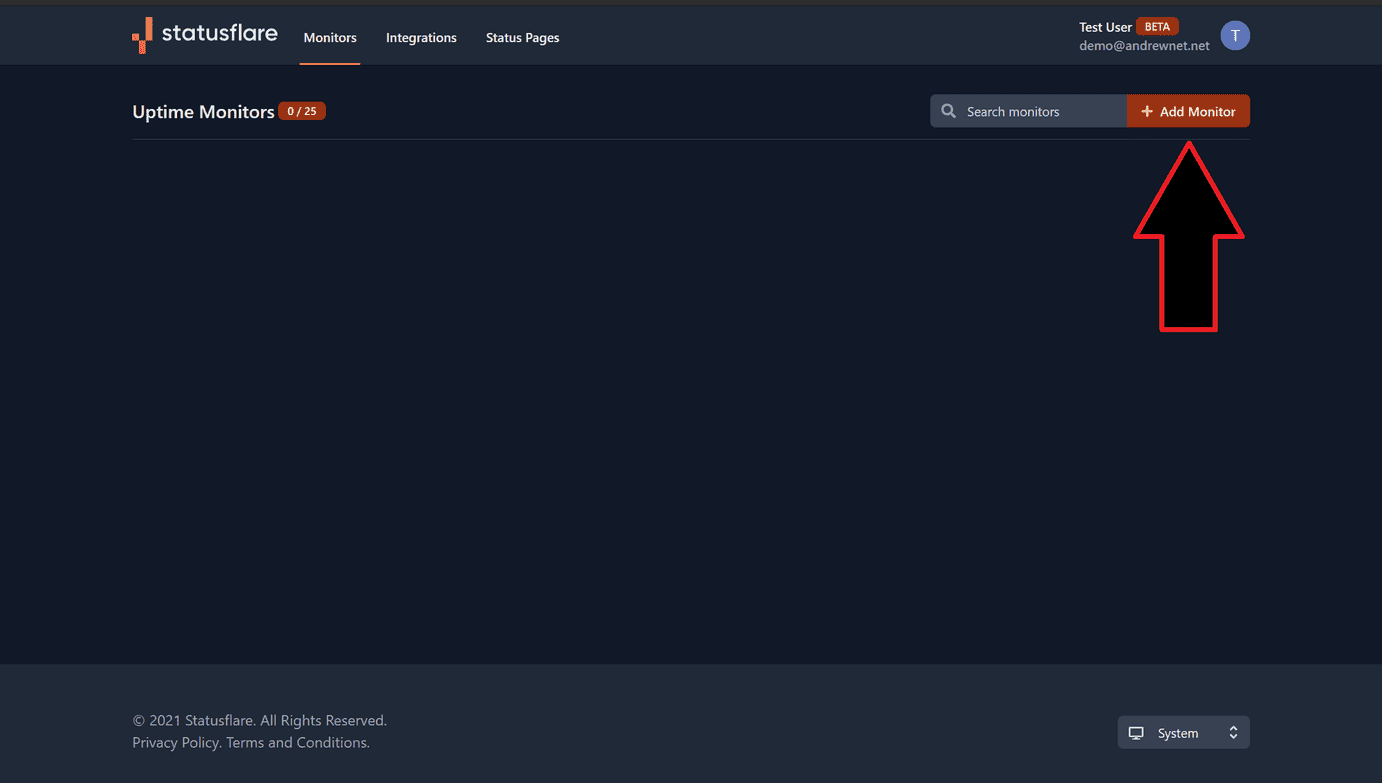
To add monitors to Statusflare press the orange "+ Add Monitor" button on the top right corner.
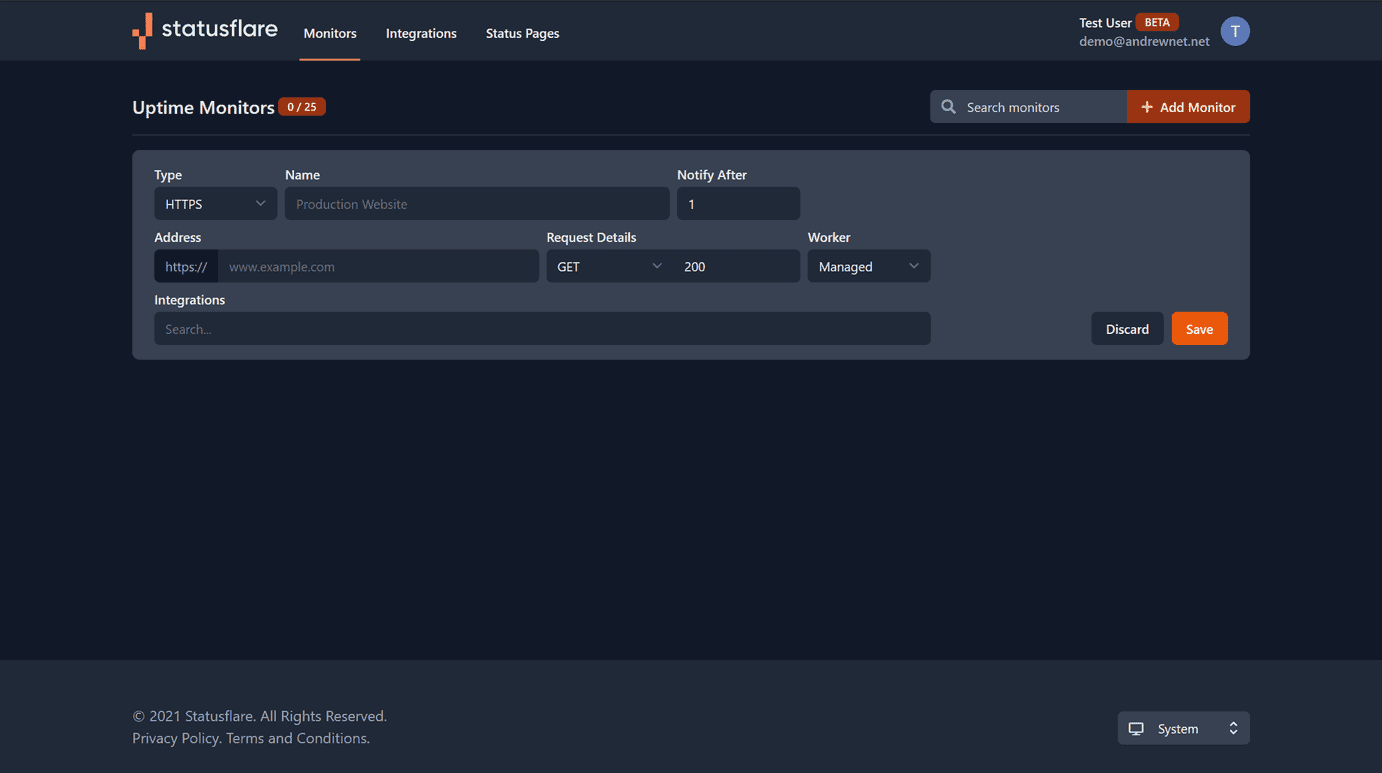
You will see a configuration windows pop up that allows you to input a few different settings.
- Type: HTTP or HTTPS.
- Name: Name of your monitor.
- Notify After: Time in minutes the status is checked.
- Address: The URL of your target.
- Request Details: Choose between GET, HEAD, POST, PUT, DELETE, OPTIONS, and PATCH. Also input expected status code (if you dont know what this means, it is probably 200).
- Worker: Managed is currently the only option.
- Integrations: Get alerted when monitor goes down.
Once you have inputted all of your settings, press "save!"
That's it! You have a fully functional uptime monitor! The next step is to configure your status page.
Status Page setup
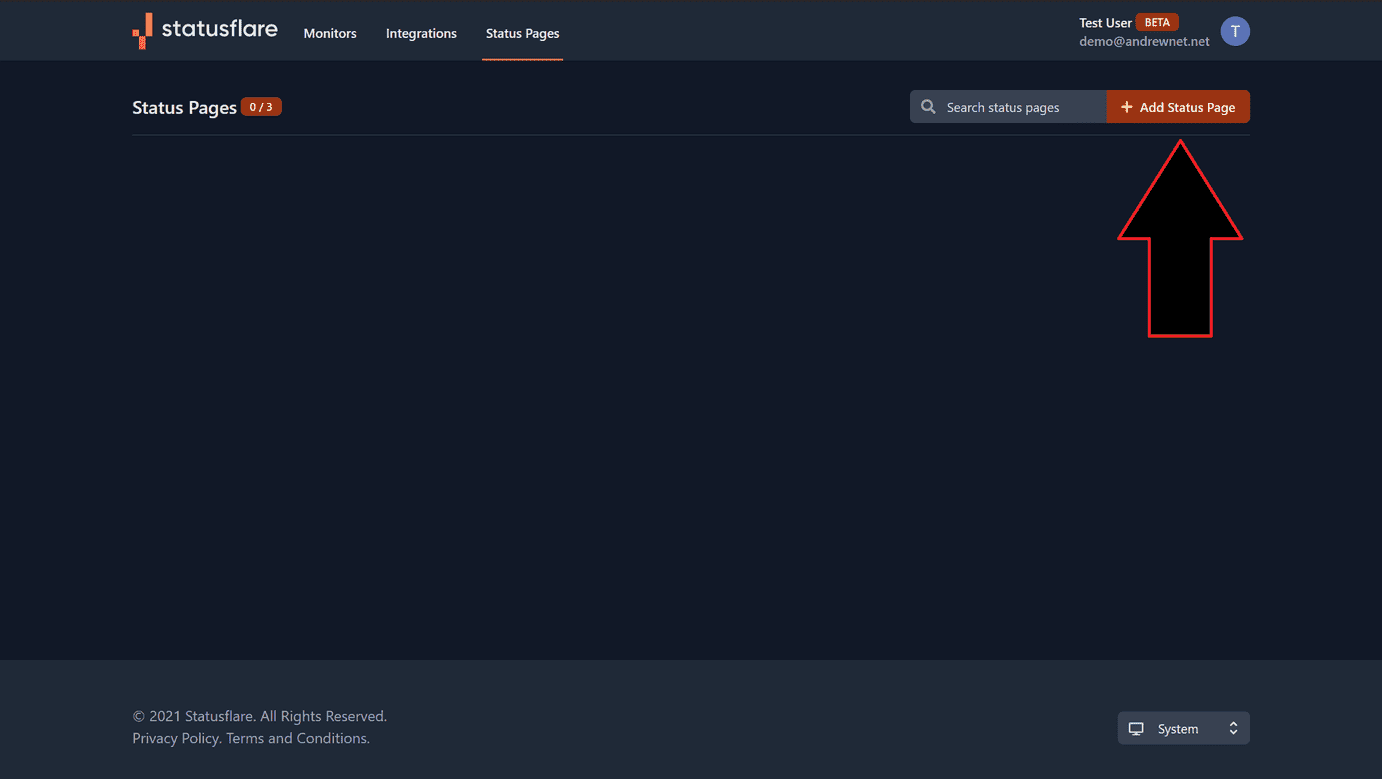
Next, find the "Status Pages" link in the top menu and press on it.
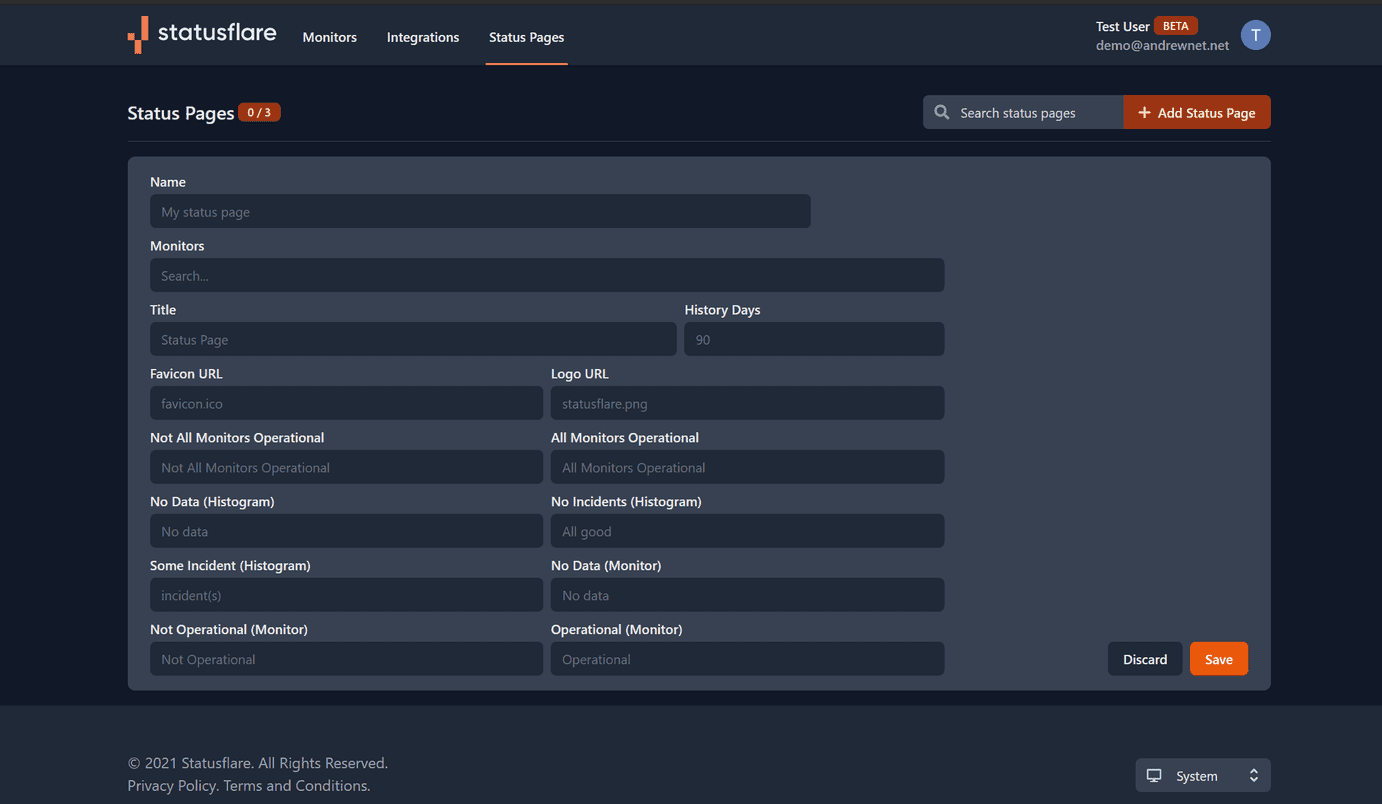
A window will open with configuration settings for your status page.
The first two settings are required
- Name: Name your status page.
- Monitors: Press on this and select what monitor you would like to be published on your page.
The next settings are optional.
- Title: Used at the top of your status page to show to users.
- History Days: The amount of days to track.
- Favicon URL: The URL of your favicon.
- Logo URL: The URL of your logo.
- Not All Monitors Operational: Customize the message that shows an outage.
- All Monitors Operational: Customize the message that shows an no issues.
- No Data (Histogram): Customize the message showing days that do not have any data yet.
- No Incidents (Histogram): Customize the all good message on individual monitors.
- Some Incident (Histogram): Customize the message that shows an outage.
- No Data (Monitor): No data for any monitors on the account yet.
- Not Operational (Monitor): Individual monitor message that shows an outage.
- Operational (Monitor): Customize the message that shows a monitor is working fine.
When done, press the save button and a link will automatically be generated to access your status page! For the first few minutes you might not see your monitor as the page initializes.
The next step is to add integrations to get alerted when one of your monitors goes down! (Optional)
